
ROSes-DB
Hierarchical Multi-Task Deep Learning Assisted Construction of Human Gut Microbiota Reactive Oxygen Species Scavenging Enzymes Database.
Background
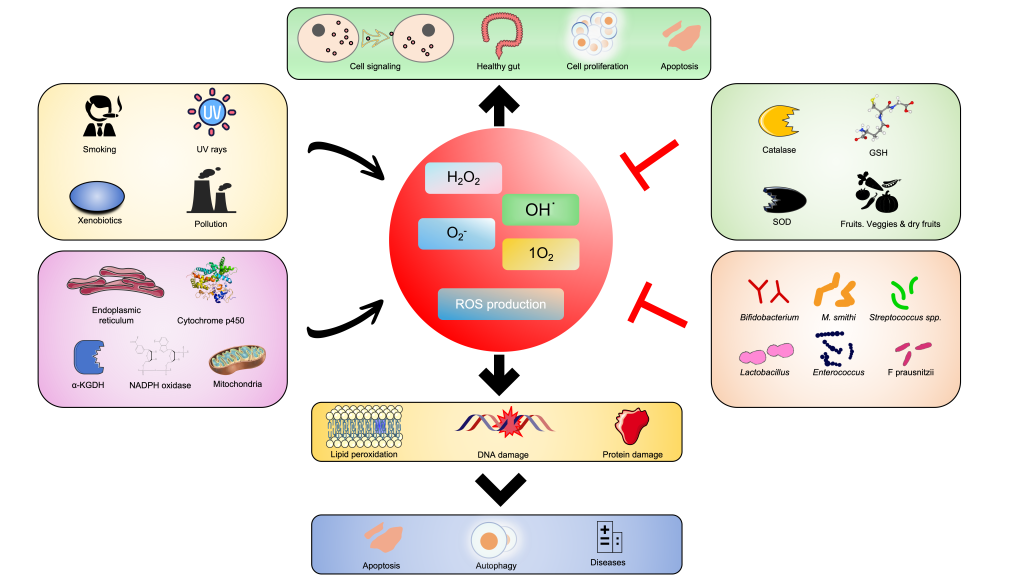
In the process of oxygen reduction, reactive oxygen species (ROSes) are generated as intermediates, including superoxide anion (O2-), hydrogen peroxide (H2O2), and hydroxyl radicals (OH–). ROS can be destructive, and an imbalance between oxidants and antioxidants in the body can lead to pathological inflammation. Inappropriate ROS production can cause oxidative damage, disrupting the balance in the body and potentially leading to DNA damage in intestinal epithelial cells and beneficial bacteria. Microorganisms have evolved various enzymes to mitigate the harmful effects of reactive oxygen species. Accurately predicting the types of reactive oxygen species scavenging enzymes is crucial for understanding the oxidative stress mechanisms and formulating strategies to combat diseases related to the ‘gut-organ axis.’ Currently, there are no available ROS databases. In this study, we propose a systematic workflow comprising three modules and employ a Hierarchical Multi-Task Deep Learning approach to collect, expand, and explore ROS-related entries. Based on this, we have developed the Human Gut Microbiota ROS Database (ROSes-DB) (http://39.101.72.186), which includes 7689 entries, bridging the gap between existing ROS databases and the human gut microbiota. This database provides user-friendly browsing and search features to support various applications. With the assistance of ROSes-DB, various communication-based microbial interactions can be explored, further enabling the construction and analysis of the evolutionary and complex networks of ROSes-DB in human gut microbiota species.
In this study, a database of ROS-active enzymes for human gut microbiota was established.Scroll down to learn more, or directly try it online.
The Distribution of ROS-Active Enzymes in the Human Gut Microbiota
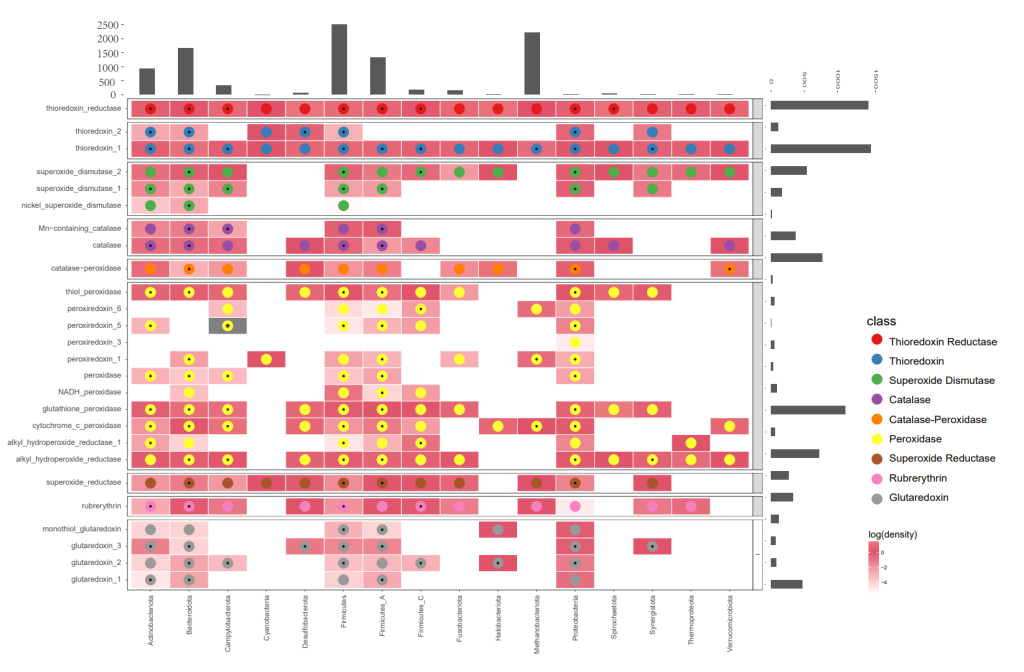
A multi-information heatmap of ROS detected in the human gut microbiota using ROSes-DB. Each column represents a phylum, with the histogram at the top displaying the number of genomes in each phylum. Rows represent ROSes protein families grouped by their functional types (labels on the left). The grayscale background at each intersection point represents the number of homologs detected in the reference protein families within the CPR or DPANN phyla, normalized by the number of genomes within the phylum. An asterisk (*) indicates the best homolog with a BLAST E-value <1e−10.
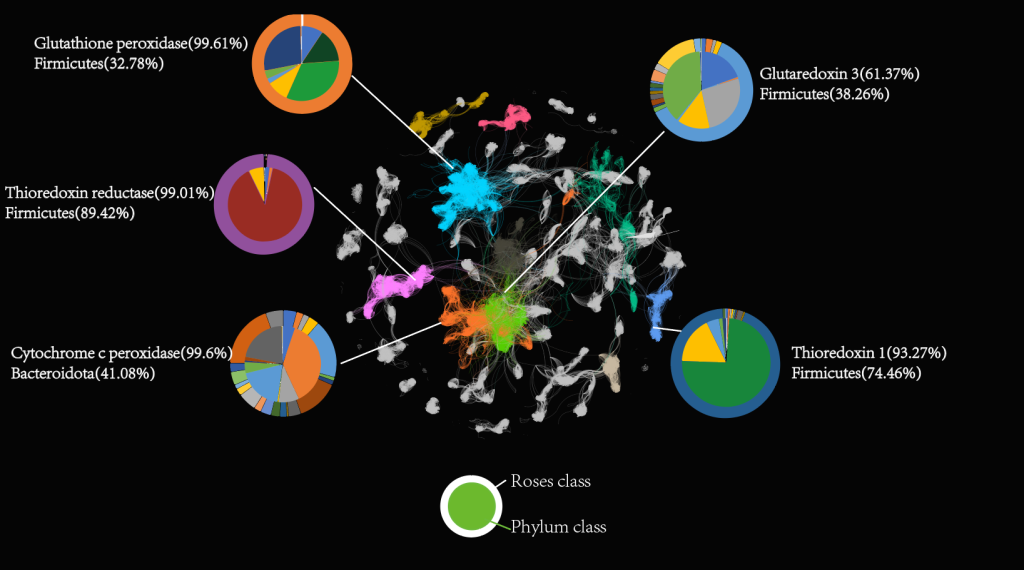
ROSes Network. In this network, we have colored only the top 8 ROS classes to highlight the key characteristics of these ROS categories. In the diagram, the outer circle represents each ROS class, while the inner circle represents the corresponding bacterial phylum. Nodes of different colors represent different ROS classes, and the lines connecting the nodes indicate sequence similarity. We performed cluster analysis on these nodes using a clustering method, with different colors representing distinct clusters.
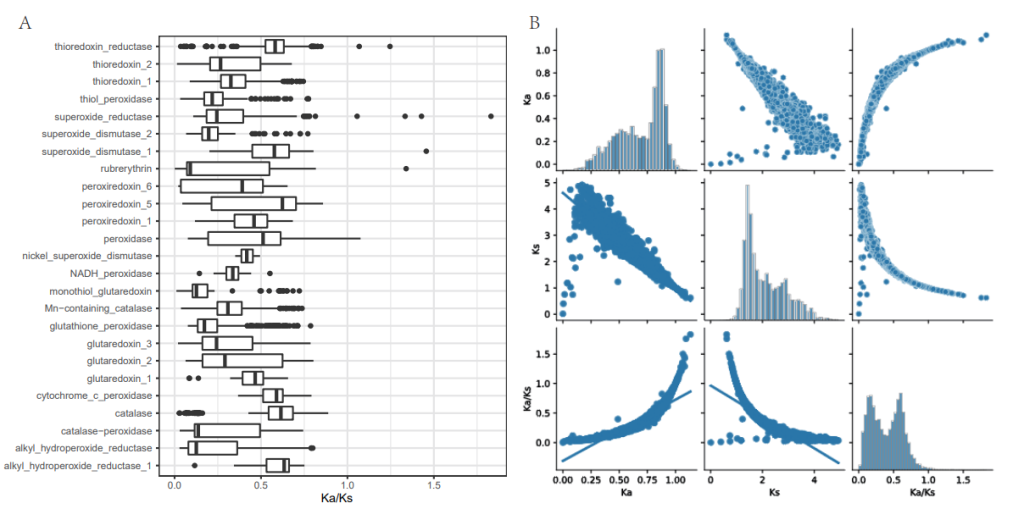
A: Boxplots depicting the distribution of dN/dS ratios for different ROS genes.
B: Distribution and correlation (Spearman rank correlation coefficients) of dN, dS, and dN/dS ratios in ROSes.
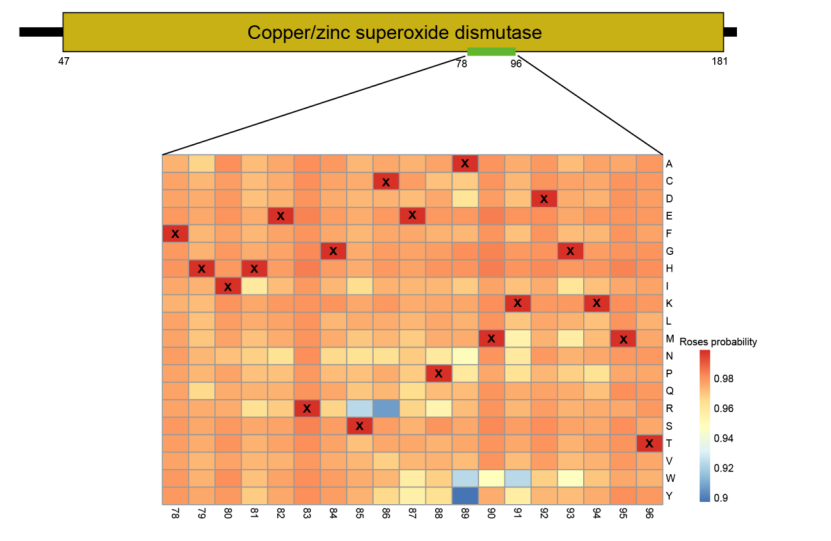
Evolutionary Analysis of the Superoxide Dismutase Sequence. The the conserved domain of the superoxide dismutase sequence (positions 47-181) is displayed, with the most crucial signal extracted from positions 78-96 for evolutionary analysis. Each column represents a position in the sequence, while rows indicate amino acid mutations. Mutated sequences were input into the model to determine the probability of each sequence being a ROS within the sequence, with corresponding probability values filled into the significant plot at their respective positions.